
The model had all the right ingredients: clean training data, carefully selected features, and performance metrics that looked solid on paper. It was designed to predict user retention, and in a controlled evaluation setting, it performed well.
But in production, cracks started to appear. Power users were being misclassified as likely to churn. Casual users were ranked unexpectedly high. The predictions were inconsistent with real-world behavior, and trust in the model began to erode.
The issue wasn’t the algorithm, it was the features. So how do you fix that?
Quantity Without Context
Most behavioral models start with the basics: session count, click rate, time on page, total interactions. These features are easy to collect and correlate well with activity, but not necessarily with intent.
For example, consider two users:
User A viewed 100 pieces of content and reacted to 5.
User B viewed 20 and reacted to 10.
Both generated interaction data. But only one demonstrated consistent, deliberate engagement. The original model couldn’t tell the difference.
That’s when a team member proposed a simple yet insightful feature: Engagement Ratio.
Introducing the Engagement Ratio
Engagement Ratio = (Number of Reactions) / (Number of Content Views)
This single metric reframed how the model understood user behavior. It captured not just what users did, but how meaningfully they interacted with the content they consumed.
import pandas as pd

# Sample user interaction data
data = {
    'user_id': [1, 2, 3, 4],
    'content_views': [100, 20, 50, 10],
    'reactions': [10, 7, 1, 3],
}

df = pd.DataFrame(data)

# Calculate engagement ratio
df['engagement_ratio'] = df['reactions'] / df['content_views']
df['engagement_ratio'] = df['engagement_ratio'].fillna(0)

print(df)
user_id content_views reactions engagement_ratio
0 1 100 10 0.10
1 2 20 7 0.35
2 3 50 1 0.02
3 4 10 3 0.30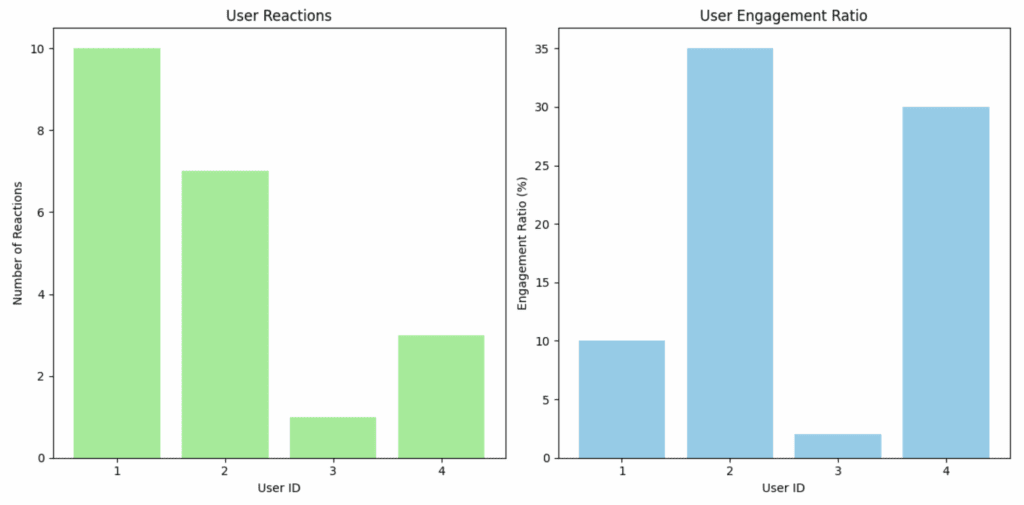
From this small sample, it becomes clear that volume isn’t everything. User 2 has significantly fewer views than User 1, yet a much higher engagement ratio. This insight proved essential.
Why It Worked
The engagement ratio changed the model’s view of user behavior. Rather than rewarding activity volume, the model began to prioritize users who showed depth of interaction.
The introduction of the engagement ratio led to measurable improvements across key performance areas. Precision in identifying high-risk users increased, allowing the model to more accurately flag those likely to churn.
Recall also improved, particularly in detecting genuinely engaged users who might have been overlooked by traditional metrics. Beyond raw performance, the model’s stability in production significantly improved, reducing erratic outputs and making it more reliable over time.
Perhaps most importantly, product teams found the predictions far more interpretable and actionable, enabling them to make confident, data-informed decisions.
Conclusion
Machine learning is often seen as a battle of algorithms, but in practice, it’s a battle of features. The engagement ratio worked because it aligned with how humans behave. It told the model: “This user didn’t just watch, they cared.”
That one ratio didn’t just improve metrics. It restored trust in the predictions and reshaped the team’s entire modeling strategy.
So before you add another deep layer to your neural network, ask: What’s the one ratio I’m missing that might tell the real story?